


Copyright © 2026 NOVABEYOND LIMITED (company number 2833487). All rights reserved.
Address: UNIT 616 6/F KAM TEEM INDUSTRIAL BUILDING 135 CONNAUGHT ROAD WEST SAI WAN HONGKONG.
For today’s marketers, Facebook is far beyond a place for community updates or brand pages. It now functions simultaneously as a content recommendation platform, advertising optimization system, customer acquisition channel, and conversion-driven marketplace. From advanced targeting powered by machine learning to integrated shopping experiences across feeds, reels, and messaging, Facebook continues to redefine how businesses reach and convert audiences.
In this environment, simply maintaining a presence on Facebook is no longer enough. Success depends on understanding how algorithmic distribution works, how user engagement behaviors are shifting, and how advertising performance data translates into sustainable growth.
To help marketers make smarter strategic decisions, we’ve compiled 100 essential Facebook statistics for 2026, covering platform reach, user demographics, engagement trends, advertising performance, and social commerce development.
These insights reveal why precision targeting often outperforms massive reach, why performance marketers still allocate significant budgets to Facebook, and why any modern social media strategy remains incomplete without a well-structured Facebook growth plan.
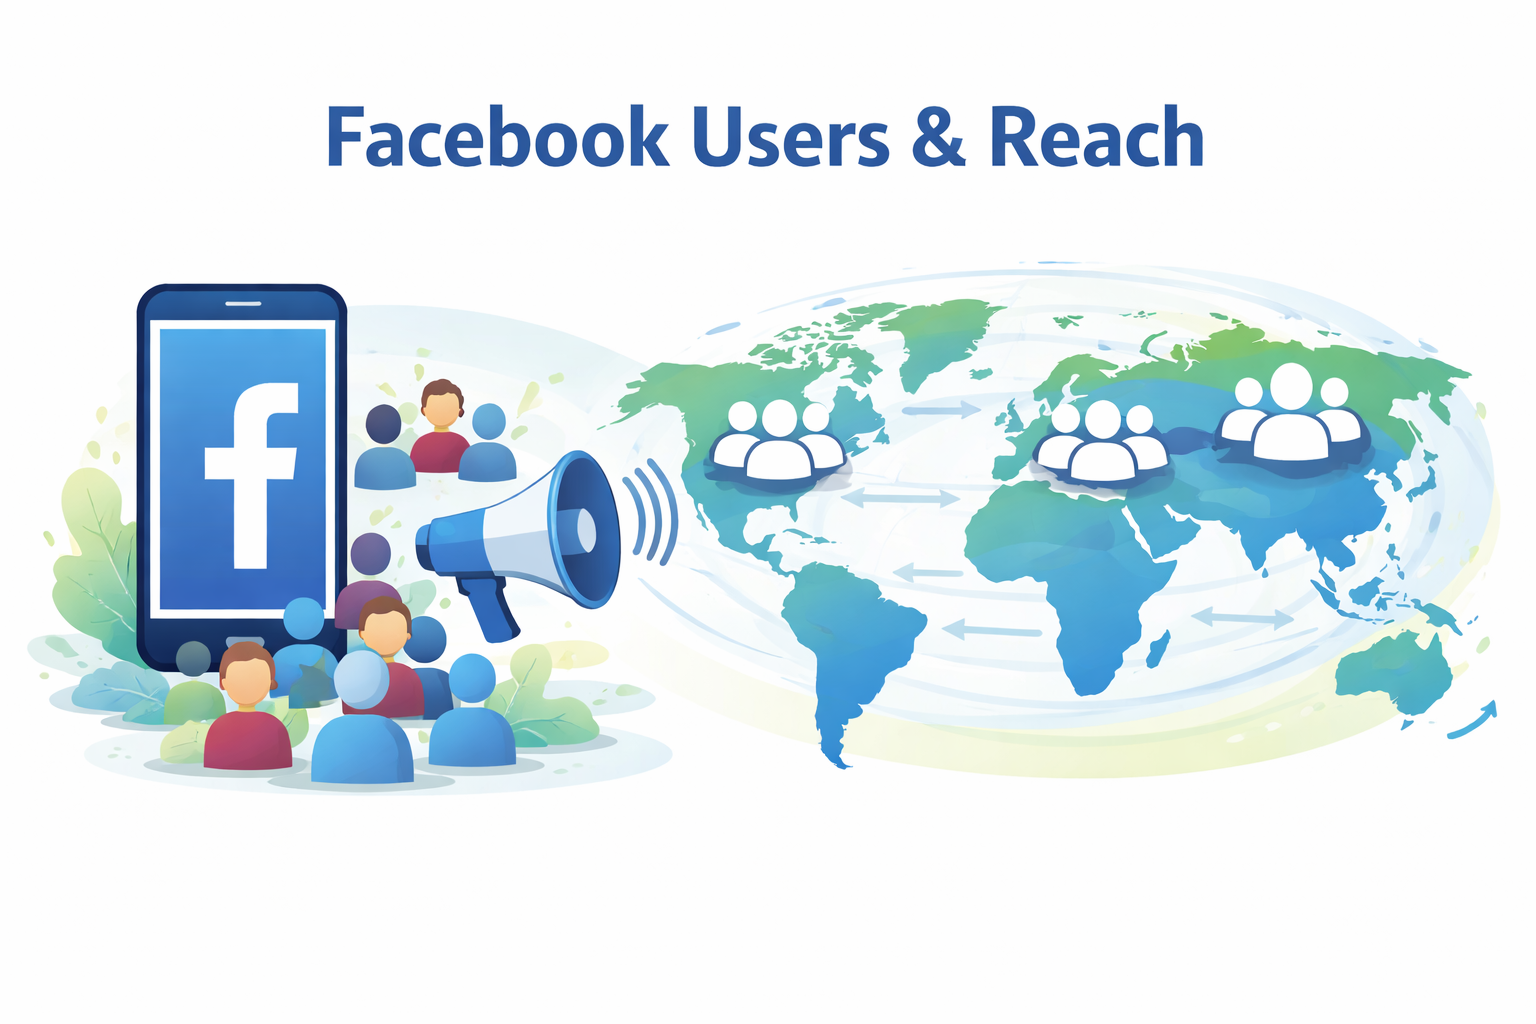
Facebook Users & Reach
1. Facebook has 3.07 billion monthly active users worldwide.
2. Facebook records 2.11 billion daily active users.
3. Facebook users represent approximately 37% of the global population.
4. Facebook advertising reach equals 2.28 billion users globally.
5. Facebook ad reach increased 5.2% year-over-year in 2025.
6. Over 68% of Facebook users log in daily.
7. Facebook operates in 100+ language interfaces.
8. Asia-Pacific accounts for over 1.3 billion Facebook users.
9. Europe has approximately 410 million Facebook users.
10. North America has about 270 million Facebook users.
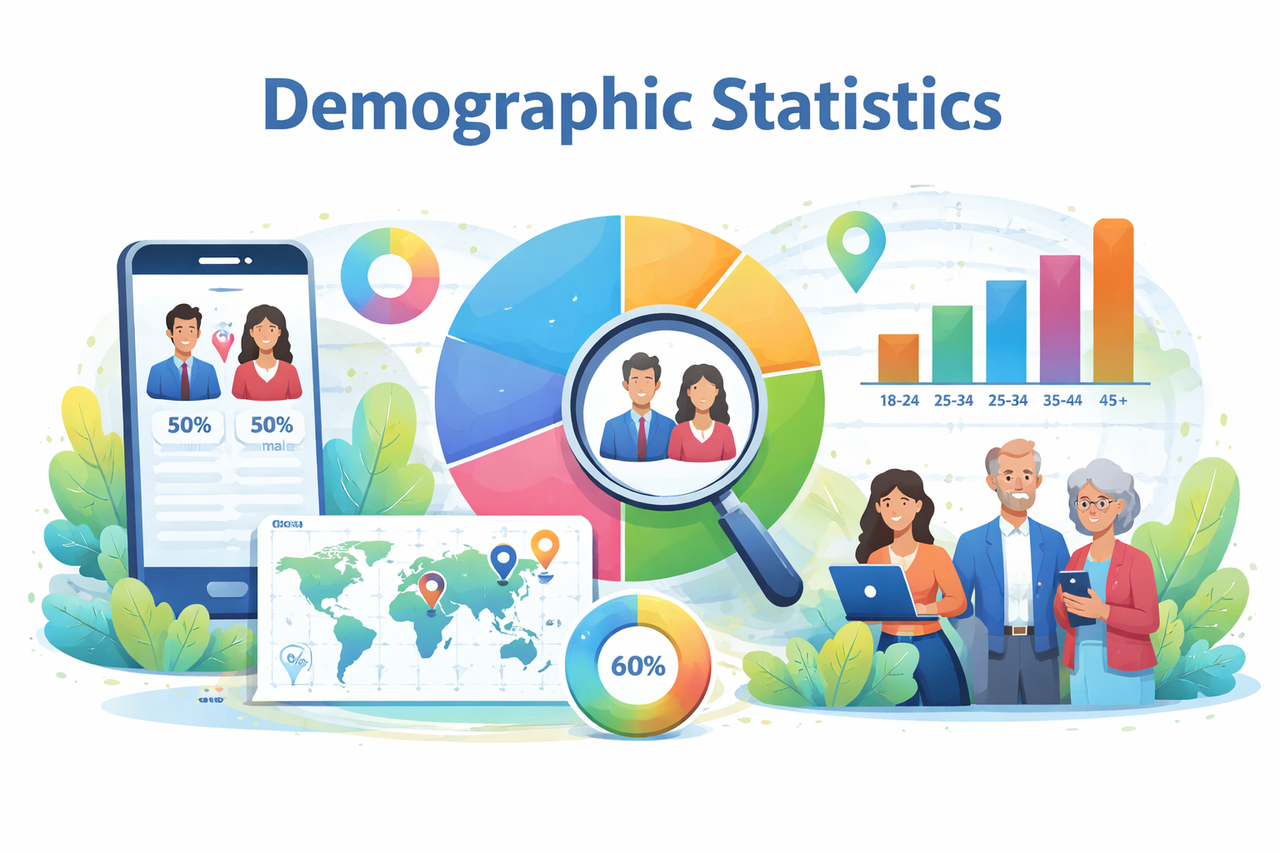
Demographic Statistics
11. Users aged 25–34 account for ~31% of Facebook’s audience.
12. Ages 18–24 represent about 23% of users.
13. Ages 35–44 represent roughly 19%.
14. Male users comprise 56.8% of Facebook ad audience.
15. Female users comprise 43.2%.
16. Over 70% of U.S. adults aged 30–49 use Facebook.
17. About 65% of U.S. adults overall use Facebook.
18. Around 73% of parents in the U.S. use Facebook.
19. Facebook penetration exceeds 80% of internet users in several Southeast Asian markets.
20. Facebook remains the #1 social platform among users aged 35+.
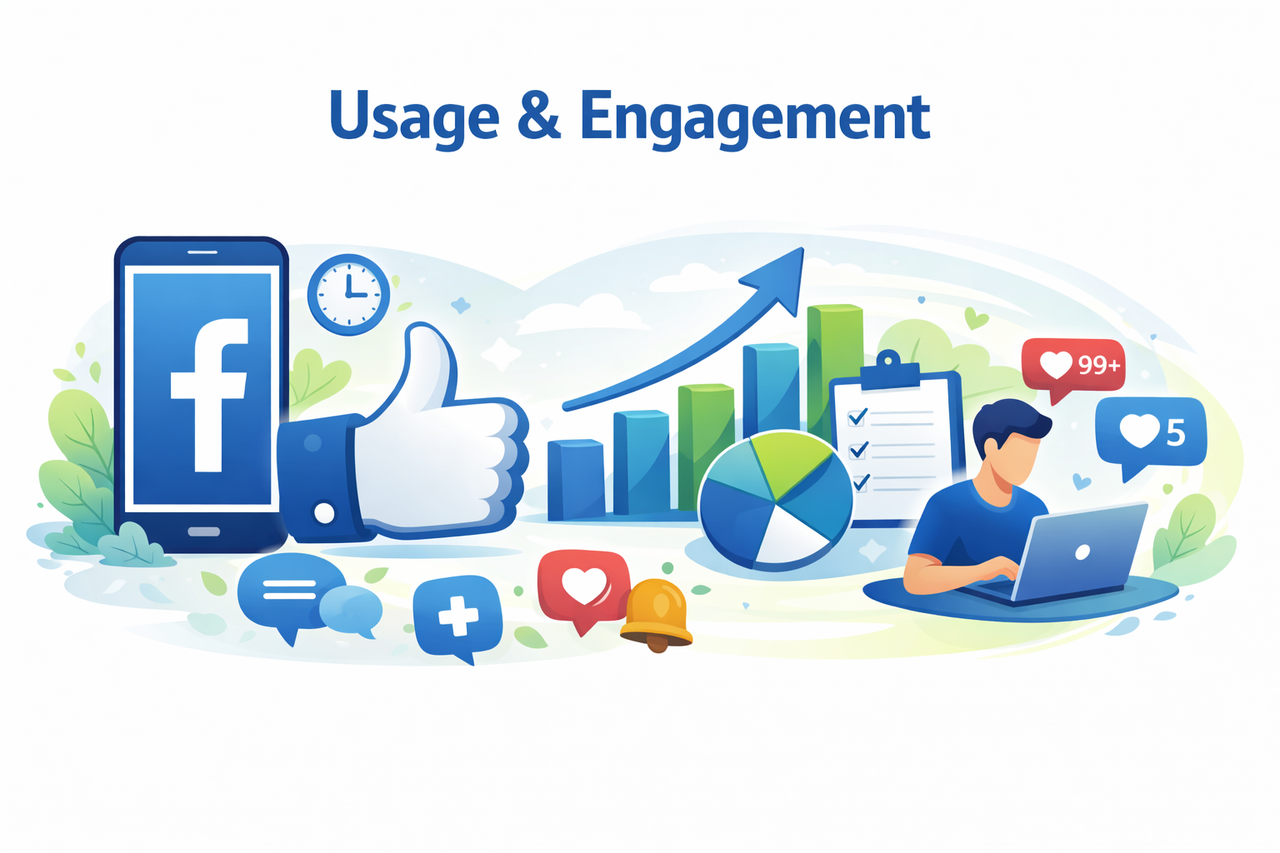
Usage & Engagement
21. Average time spent on Facebook is 33 minutes per day.
22. Facebook users generate over 4 petabytes of data daily.
23. More than 1 billion Stories are shared daily across Facebook apps, including Facebook.
24. Facebook Groups have 1.8 billion monthly active users.
25. Over 10 million active Facebook Groups exist globally.
26. Facebook users upload hundreds of millions of photos daily.
27. Over 500 million people watch Facebook video daily.
28. Facebook Live videos receive 6× more interactions than standard videos.
29. Video posts generate 59% more engagement than other post types.
30. Posts with images see 2.3× more engagement than text-only posts.
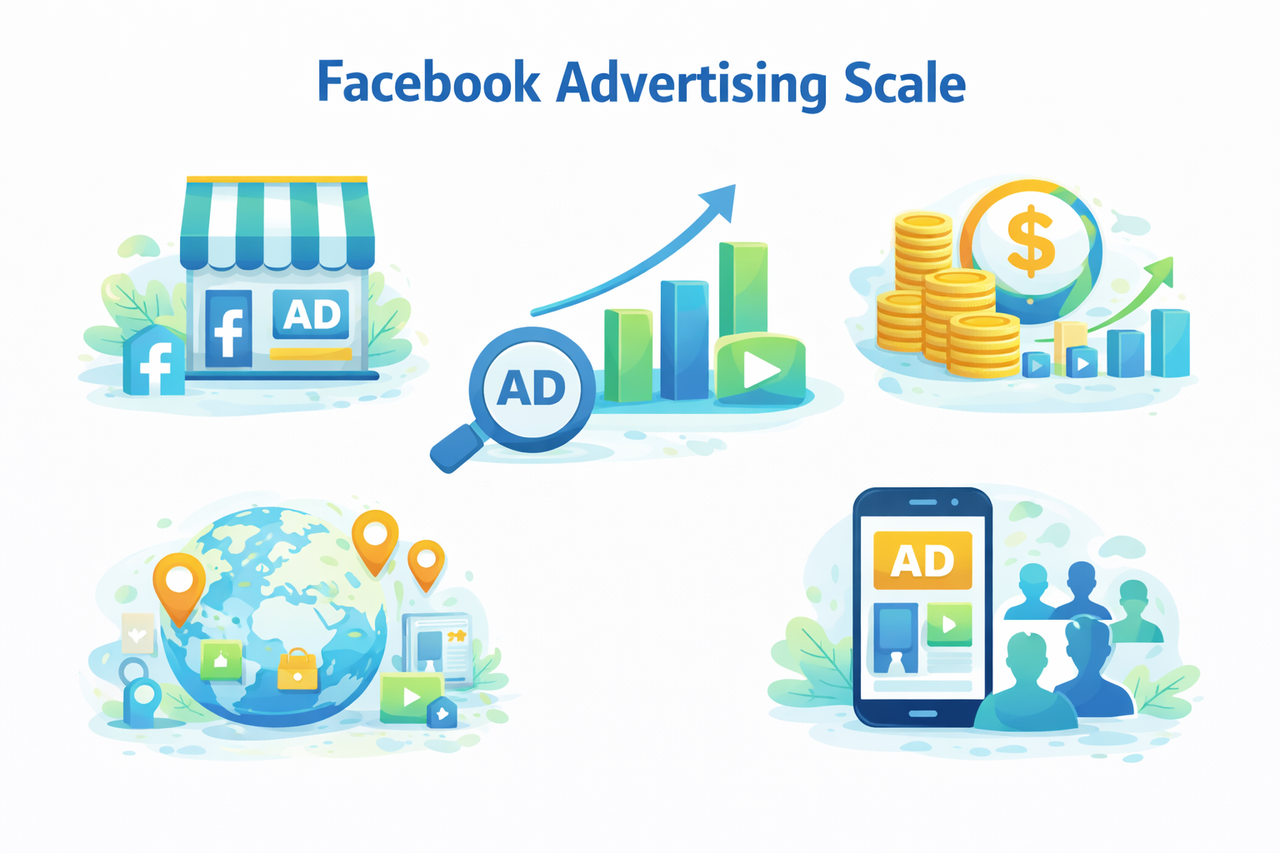
Facebook Advertising Scale
31. More than 10 million advertisers actively use Facebook ads.
32. Facebook ads reach 74% of total Facebook users.
33. Facebook generates over $130 billion in ad revenue annually.
34. Advertising accounts for 97%+ of Meta revenue, largely driven by Facebook.
35. Over 200 million businesses use Facebook tools.
36. Facebook Pages exceed 90 million active business pages.
37. Small businesses represent over 80% of Facebook advertisers.
38. Facebook serves billions of ad impressions daily.
39. Average Facebook ad frequency globally ranges between 1.8–2.5 weekly exposures.
40. Automated placements deliver ads across 6+ Facebook inventory surfaces.
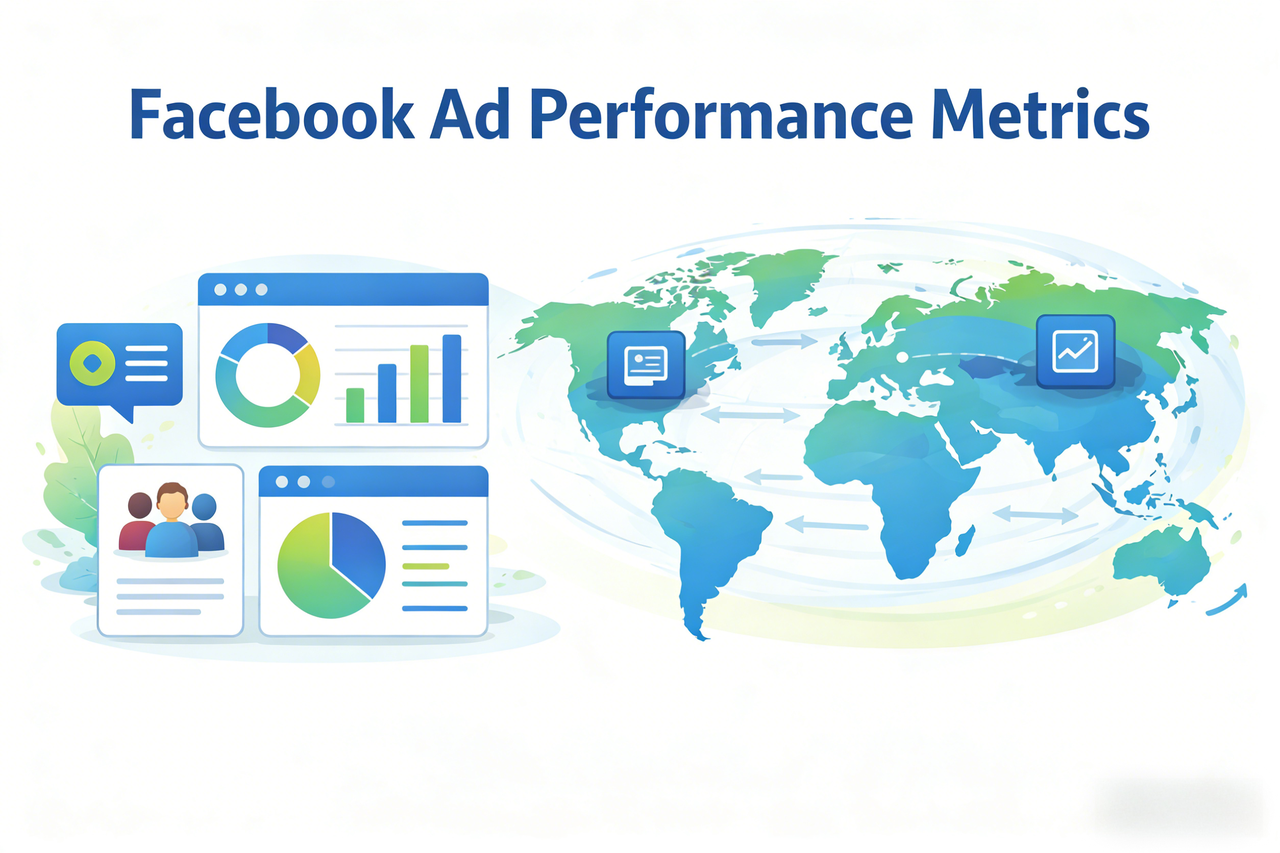
Facebook Ad Performance Metrics
41. Average Facebook ad CTR is approximately 1.44%.
42. Lead generation ads average 2.53% CTR.
43. Traffic campaigns average 1.57% CTR.
44. Engagement campaigns average 1.43% CTR.
45. Facebook ads average conversion rate is 9.21%.
46. Retail industry Facebook CTR averages 1.59%.
47. Real estate Facebook CTR averages 2.60%.
48. Fitness industry CTR averages 1.90%.
49. Education industry CTR averages 1.66%.
50. Finance industry CTR averages 1.34%.
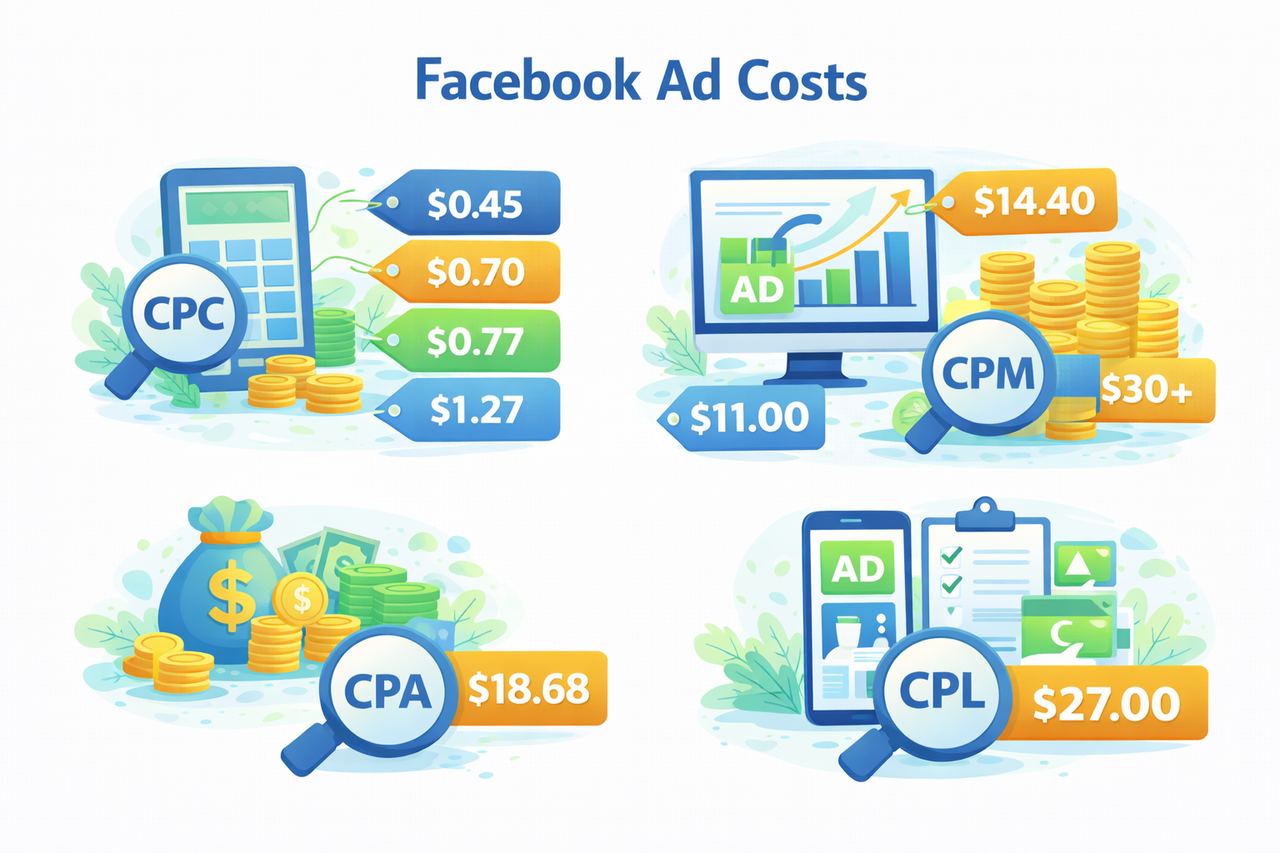
Facebook Ad Costs
51. Average Facebook CPC across industries is $0.77
52. Retail CPC averages $0.70.
53. Apparel CPC averages $0.45.
54. Finance CPC averages $3.77.
55. Technology CPC averages $1.27.
56. Average Facebook CPM is $14.40.
57. Retail CPM averages $11.00.
58. Finance CPM exceeds $30 in competitive markets.
59. Average CPA on Facebook is $18.68.
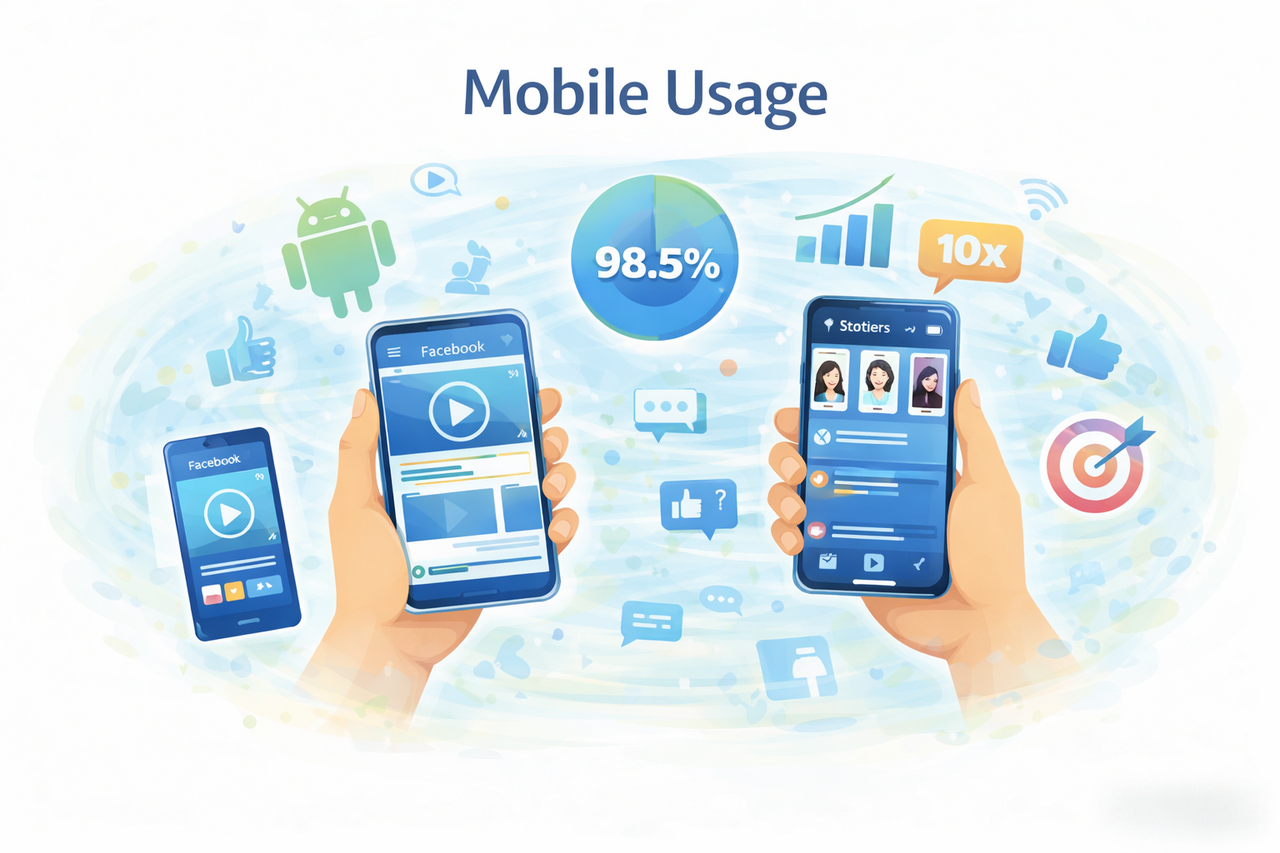
60. Average CPL on Facebook is $27.00.
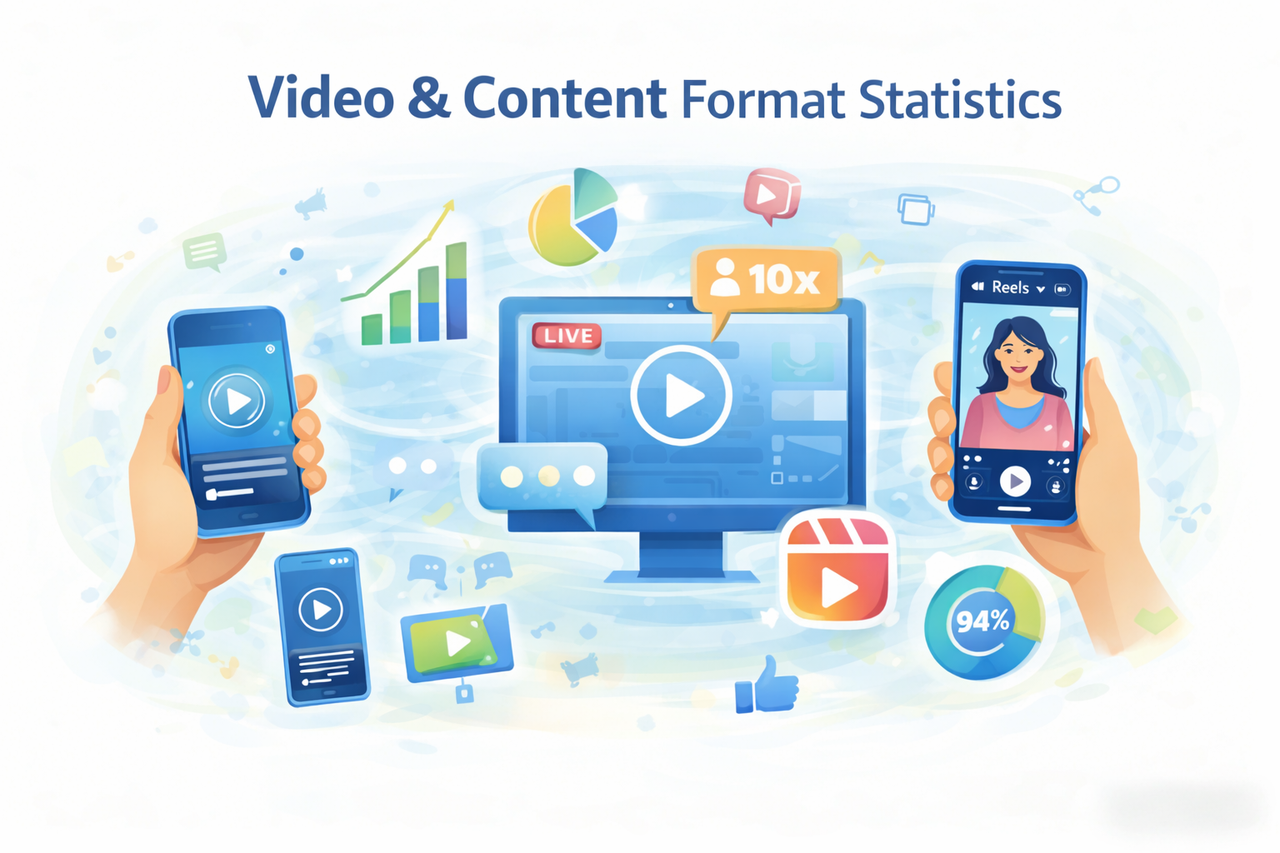
Video & Content Format Statistics
61. Video accounts for over 50% of time spent on Facebook.
62. Vertical videos increase completion rates by up to 35%.
63. Captioned videos increase watch time by 12%.
64. Short videos under 15 seconds see highest completion rates.
65. Reels consumption grew double digits YoY.
66. Users share video content twice as often as links.
67. Live videos generate 10× more comments than regular videos.
68. Facebook video view counts exceed 8 billion daily views.
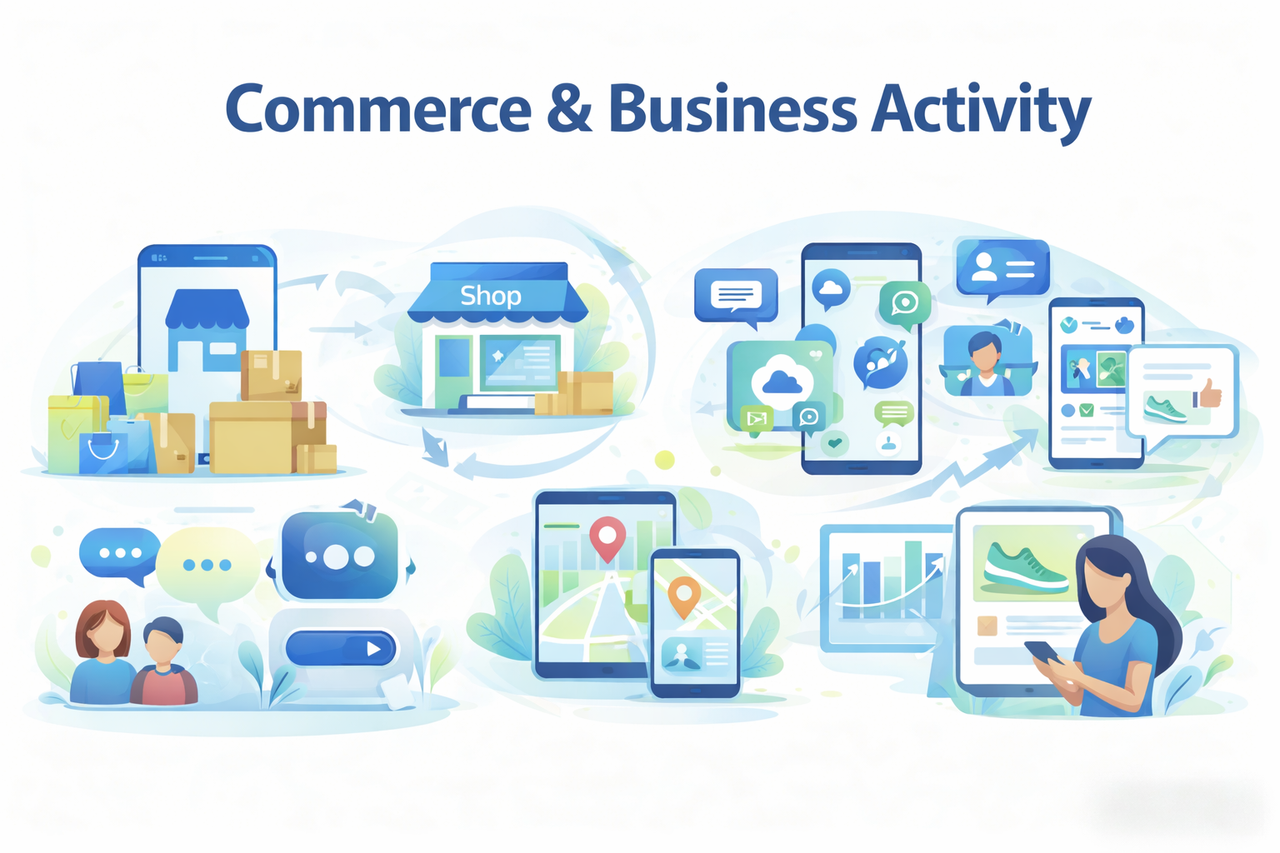
69. Mobile accounts for 94% of Facebook video views.
70. Square video formats increase engagement by 30%.
Mobile Usage
71. 98.5% of Facebook users access via mobile devices.
72. Mobile generates over 94% of Facebook ad revenue.
73. Mobile feed impressions exceed desktop impressions by 10×.
74. Mobile users check Facebook multiple times daily on average.
75. App usage accounts for over 80% of total Facebook time spent.
76. Android devices represent the majority of Facebook access globally.
77. Mobile-first creatives improve CTR by 20%+.
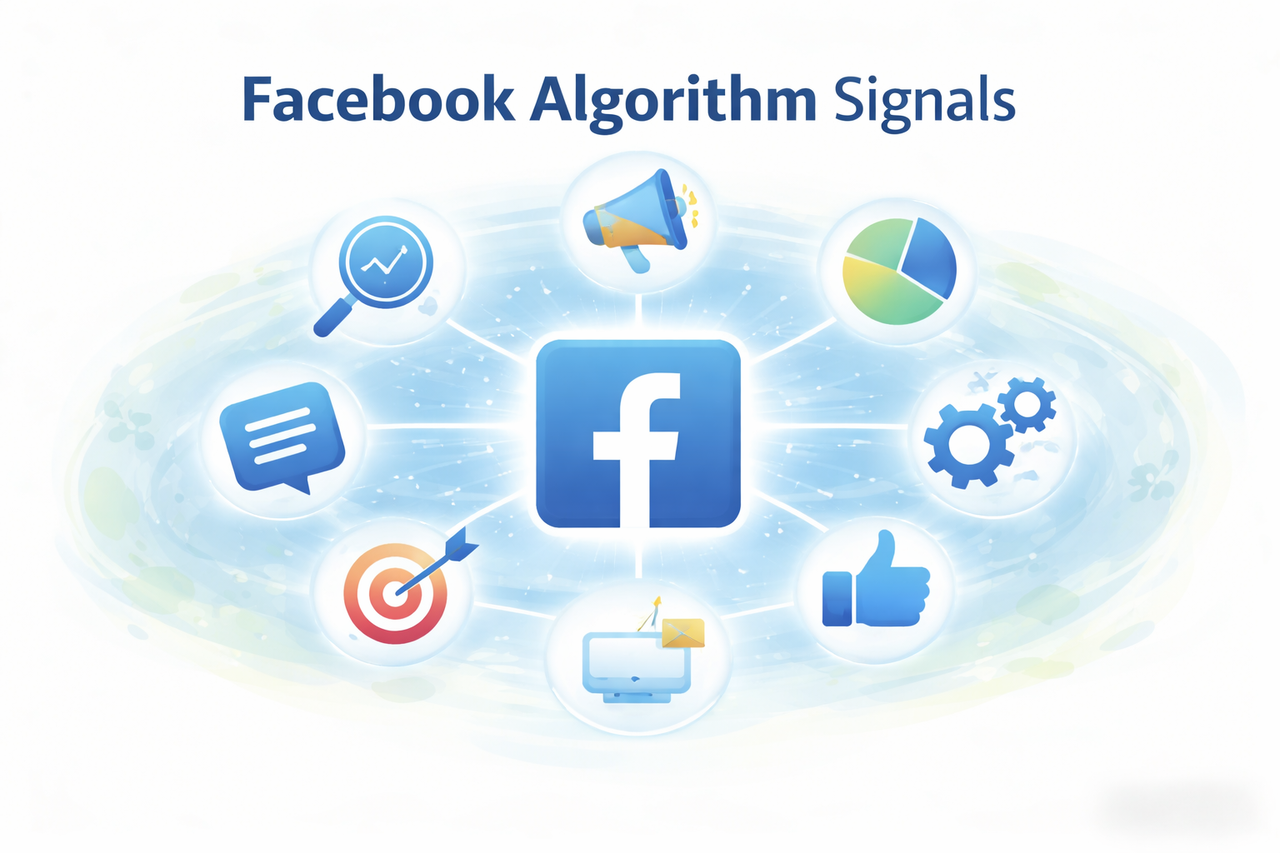
78. Vertical placements dominate mobile inventory.
79. Mobile Stories reach hundreds of millions daily users.
80. Mobile engagement rates exceed desktop engagement rates consistently.
Commerce & Business Activity
81. Facebook Marketplace reaches over 1 billion users monthly.
82. Over 1 billion people interact with Shops monthly across Meta platforms including Facebook.
83. Click-to-Message ads drive billions of conversations annually.
84. Messenger has over 1 billion monthly users connected to Facebook accounts.
85. Facebook Pages receive billions of messages monthly.
86. Local business discovery via Facebook exceeds 50% of users in some markets.
87. Product discovery via Facebook feeds influences 60%+ of shoppers.
88. Facebook recommendations influence purchase decisions for over half of users.
89. Facebook Shops adoption grew double digits annually.
90. Businesses using messaging ads see faster response conversion cycles.
Platform & Algorithm Signals
91. Facebook Feed ranking considers thousands of signals per post.
92. AI models evaluate engagement probability in milliseconds.
93. Recommendation systems drive a growing share of feed impressions.
94. Content recommendation usage increased year over year since 2023.
95. AI moderation reviews billions of posts daily.
96. Facebook removes millions of fake accounts daily.
97. Over 95% of harmful content is detected proactively by AI.
98. Facebook invests tens of billions of dollars annually into AI infrastructure.
99. Machine learning models continuously retrain using platform interaction data.
100. AI-driven ad delivery determines the majority of impression allocation today.
Facebook in 2026 is no longer defined by social interaction alone.
It is:
a global advertising infrastructure
an AI-driven optimization engine
a mobile-first performance platform
and still one of the most scalable acquisition channels available to marketers.
The marketers winning on Facebook today are not those chasing trends, but those aligning with automation, creative iteration, and data-driven execution.
more posts
OEM Advertising : How Device-Level Placements Drive App Growth in Emerging Markets
July. 13 2026
LEARN MORE

MediaGo, Taboola, and Outbrain: How Native Ad Platforms Differ for E-commerce Brands
June. 22 2026
LEARN MORE
BIGO Ads vs Kwai Ads: How Geography and Category Shape Performance in Short-Video Ecosystems
June. 16 2026
LEARN MORE
Why TikTok Ads Live or Die by Creative and Meta Ads by Structure
June. 09 2026
LEARN MORE