




Copyright © 2026 NOVABEYOND LIMITED (company number 2833487). All rights reserved.
Address: UNIT 616 6/F KAM TEEM INDUSTRIAL BUILDING 135 CONNAUGHT ROAD WEST SAI WAN HONGKONG.
Introduction
CTV spend often clears the first review, then stalls when finance asks a harder question: which revenue would not exist if the TV budget had stayed dark? Completions, view-through ROAS, and CPM describe delivery. They do not tell you what CTV caused.
That makes how to measure CTV ROI a practical operating problem in 2026. The screen rarely produces a click. The same household can see a CTV spot, search on a phone later, and convert through another channel that also claims the order. Last-click models can ignore the TV entirely. Loose view-through windows can credit demand that was already coming.
IAB reported US CTV ad spend of $23.6 billion in 2024 after 16% year-over-year growth, with a 2025 projection of $26.6 billion. Buyers in that study expected nearly half of CTV inventory to be biddable. More addressable supply does not solve a weak causal read. Platform ROAS can cut a channel that assists mobile or scale one that mainly captures demand created elsewhere.
The measurement problem is therefore bigger than attribution. Growth teams need a framework that separates what happened after exposure, what happened because of CTV, and whether the incremental result justified the spend.
This guide is for brand marketers, media buyers, and growth leads who already buy video. If you want the measurement stack designed around your conversion event, markets, and current media mix, talk with Novabeyond before the next flight.
Build a CTV measurement framework with Novabeyond
Quick Answer
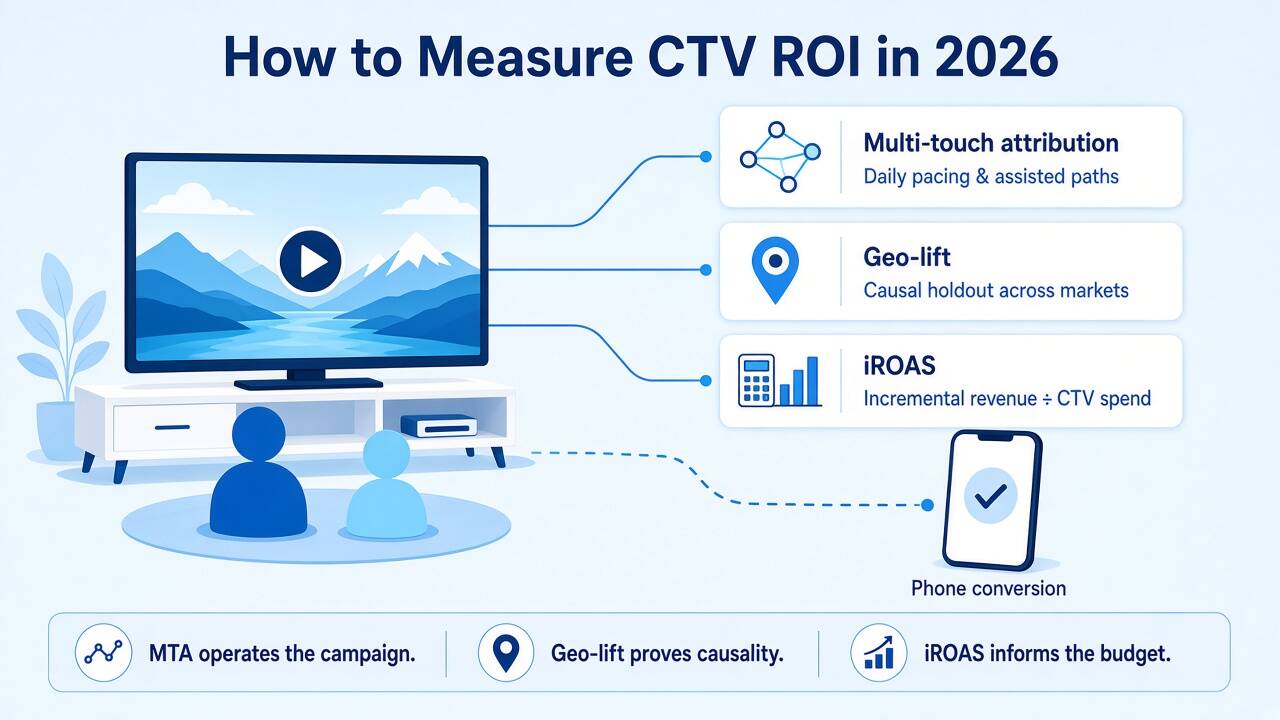
To measure CTV ROI in 2026, use three measurement layers. Multi-touch attribution (MTA) helps with daily pacing, assisted conversions, and creative optimization. Geo-lift or another holdout test estimates the revenue that would not have occurred without CTV. Incremental ROAS (iROAS) converts that causal lift into a budget metric by dividing incremental revenue by CTV spend. Do not scale from attributed ROAS alone. Match the attribution window to the purchase cycle, control household frequency, keep other major channels consistent across test and control, and report iROAS together with the methodology and confidence range.
CTV ROI Measurement Framework
Measurement Layer Core Question Primary Metric Best Use Multi-Touch Attribution What happened after CTV exposure? Assisted conversions / attributed revenue Daily optimization Geo-Lift What changed because of CTV? Incremental lift Causal validation iROAS Was the incremental result worth the spend? Incremental revenue ÷ CTV spend Budget and scaling decisions Media Mix Modeling How does CTV contribute over time? Contribution, lag, saturation Longer-term allocation
No single measurement method answers every question. MTA is useful for operating the campaign. Geo-lift helps establish incrementality. iROAS gives finance a number it can compare with other growth channels. MMM can then place CTV inside the broader annual media plan.
Why Platform ROAS Misreads Connected TV
Search and paid social trained teams to trust a click path. CTV breaks that habit in three important ways.
The screen is shared. A household impression is not the same as a person's impression. Co-viewing can undercount people's reach, while identity graphs can merge devices that do not share with a buyer. If your measurement logic assumes one user and one device, the ROI calculation starts with the wrong unit.
The action happens later, and often elsewhere. A viewer can see a 15- or 30-second spot, then install, register, or purchase on a phone hours or days later. A one-day click window can show almost nothing. A 30-day view-through window can show a lot, including people who would have converted through branded search, retargeting, or organic demand anyway.
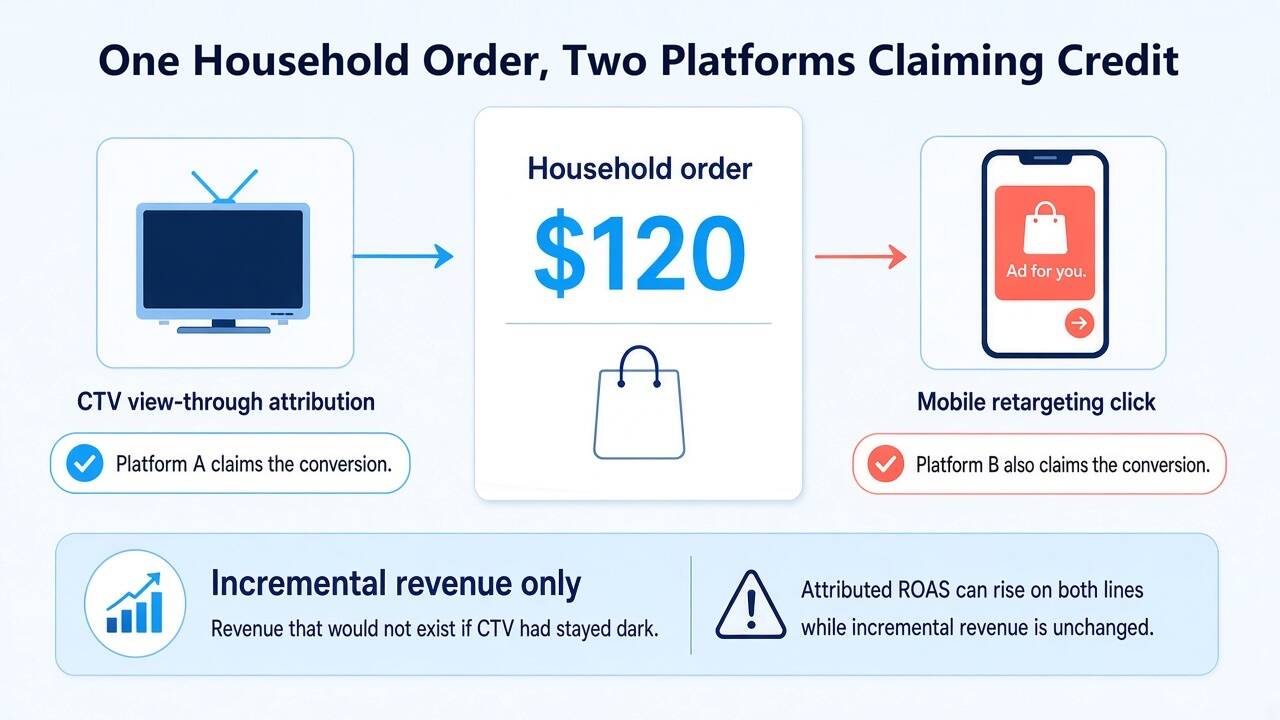
Two systems can claim the same order. When programmatic display and CTV overlap, each platform can log the conversion inside its own attribution window. Neither necessarily deducts the other. Attributed ROAS can rise on both lines while incremental revenue remains unchanged.
The IAB Standardized Measurement Guide for CTV (December 2025) addresses the need for more consistent definitions across areas such as impression, viewability, reach, frequency, and attention. IAB and MRC video impression guidance also highlights CTV measurement challenges including limited tracking tags, TV-off playback, and continuous play that can count delivery when nobody is watching.
Clean the delivery signal before you argue about ROI. A high completion rate can confirm that an ad was delivered successfully, but it does not prove that the exposure generated an incremental sale.
Novabeyond treats CTV as a performance-enabled layer inside OEM & CTV Growth Channels, combining large-screen exposure, household targeting, and the conversion events that growth teams already track across mobile and web. The measurement framework should be part of the media design from the beginning, not an analysis added after the budget is spent.
The case for putting CTV into a performance plan is covered in when CTV becomes a growth channel. This guide focuses on the measurement question that follows: which number should influence the next budget decision?
How to Use CTV Multi-Touch Attribution Without Overclaiming ROI
MTA is a useful daily instrument. It is not, by itself, a causal measurement of CTV.
CTV enters the conversion path as a view rather than a click. Credit may be distributed across the TV exposure, a later search, an app session, and a retargeting impression. Impression logs therefore need to land in the same attribution environment as mobile and web data, with a stable household or device key and a timestamp.
If CTV exists only in a separate reach report, it never receives assisted credit. Last-click channels then appear cheaper because the TV exposure is missing from the path.
Household graphs and probabilistic matching can help build the identity layer, but they should support the daily read only when the underlying match remains stable. Monitor match rates week to week, confirm that household keys remain consistent throughout the flight, and make sure the device relationships can be audited.
If the match rate swings, confidence tiers are hidden, or a shared TV is linked to phones that do not belong to the same buyer, keep that graph out of the budget conversation. MTA can still reveal assisted paths. It should not determine the next CTV budget until a holdout provides evidence of incremental revenue.
Set the CTV View-Through Window Around the Buying Cycle
Do not simply accept a platform's default attribution window.
7 days can work for app installs, trials, and fast ecommerce events.
14 days can fit considered purchases where search and conversion lag are longer.
30 days should be reserved for categories with a genuinely longer conversion cycle and should be checked against an incrementality test.
The principle is simple: too short, and CTV may receive little credit even when it assists conversion. Too long, and CTV can absorb demand that would have converted without the exposure.
Publish the window in the media brief so optimization and finance are working from the same measurement clock.
MTA can show which creative appears on assisted paths, which dayparts precede site visits, which publishers generate view-through events that also correlate with paid-search activity, and whether additional household frequency continues to generate assisted conversions. It cannot answer the counterfactual: would these people have converted if CTV had not been shown? That is where incrementality testing becomes necessary.
IAB and IAB Europe define incrementality around additional outcomes compared with what would have happened without the activity. A credible counterfactual is therefore central to the measurement design.
MTA can explain the path. A holdout can provide stronger evidence about causality. The claim that CTV cannot be measured at all is addressed among the five misconceptions about CTV advertising. The practical solution is to match the measurement method to the business decision rather than rely on one dashboard for everything.
How to Run a CTV Geo-Lift Test Finance Can Audit
Geo-lift is one of the most practical causal approaches for CTV when household-level randomized holdouts are not available.
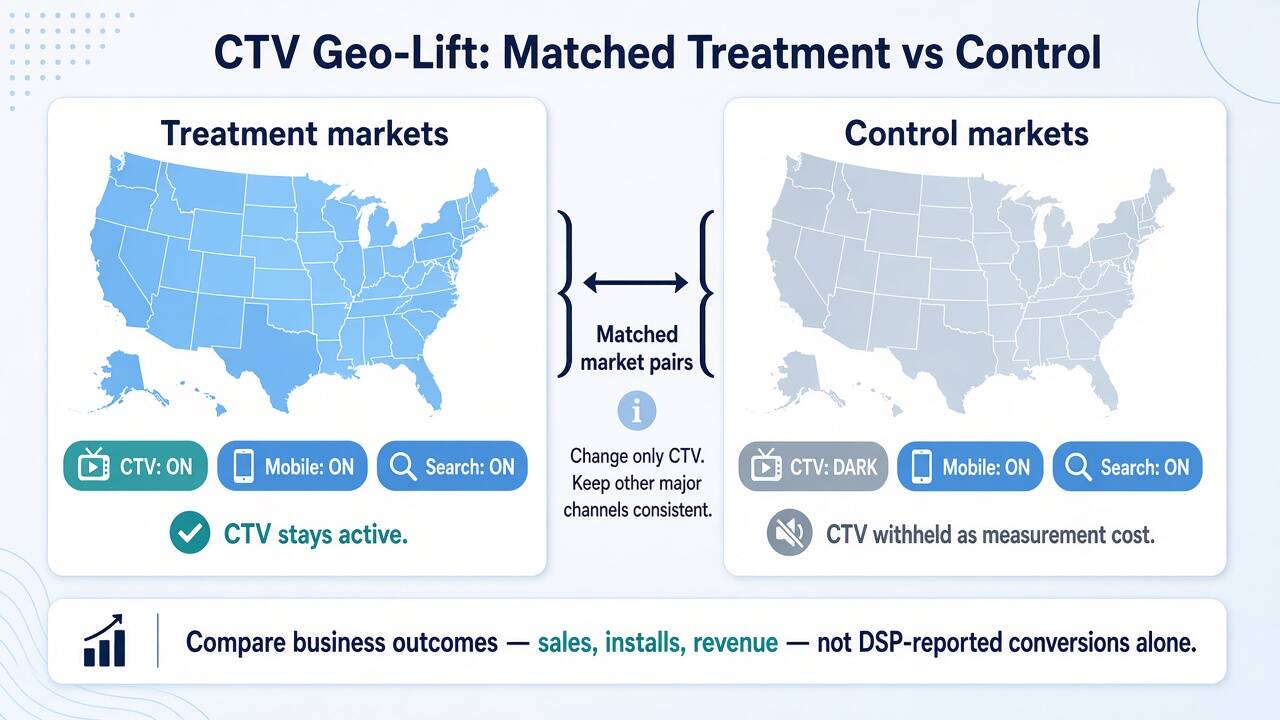
Keep CTV active in treatment markets and dark, or sharply reduced, in matched control markets. Then compare outcomes in your own sales, install, revenue, or other business systems rather than relying only on DSP-reported conversions. The goal is to estimate the difference between what happened with CTV and what would have happened without it.
A usable design follows six rules.
1. Match markets first. Pair regions on population, category demand, historical conversion rates, and other factors that influence the business outcome. A local promotion running in one city is not a valid control.
2. Change only CTV. Keep mobile, OEM, search, and always-on programmatic activity running consistently across both groups. Pausing retargeting in the holdout measures a broader media mix change rather than the effect of CTV.
3. Pre-register the measurement window. Confirm that treatment and control markets moved together before the test. Run enough time to cover a meaningful buying cycle. Many app and ecommerce tests may need roughly four to six weeks, depending on the conversion cycle and available volume.
4. Budget the dark share before the buy. A control group that is too small may lack statistical power. A control group that is too large can sacrifice unnecessary reach. Treat withheld impressions as a measurement cost and define the control in advance. Do not reopen the control simply because it looks idle during the flight.
5. Log non-media shocks. A regional price promotion, app-store feature, distribution change, or major local event can imitate media lift. Record these factors before interpreting the result.
6. Read beyond the site pixel. Include branded search, installs, marketplace orders, store visits, or other meaningful business outcomes when relevant. Last-click ecommerce alone can understate CTV's contribution.
Audience-level holdouts can be stronger when a platform supports reliable random suppression, but fragmented CTV buying does not always allow that design. PSA tests can answer certain brand questions, while calendar on/off tests can introduce substantial confounding.
Geo-lift can provide a practical and auditable framework when finance needs a causal read and household-level randomization is unavailable.
Media mix modeling serves a different purpose. MMM can help estimate contribution, lag, and saturation across longer periods. Geo-lift tests whether a specific CTV flight produced incremental outcomes. The two methods can complement each other rather than compete.
Keep device media on a separate test if it launches in the same month. A TV household and an OEM placement are different media moments, and one blended readout can make it difficult to identify which screen generated the lift. The OEM advertising growth framework covers the device side.
Teams already running programmatic CTV buying should apply one consistent geo design across direct deals, private marketplaces, and open exchange. The buying method does not change the causal question. It changes the supply-quality controls you need.
Invalid traffic, TV-off delivery, and uncontrolled frequency can make a well-designed test look like a weak channel when the real problem sits in the supply path.
If the budget is too thin or the market list is too messy for a credible holdout, do not force a false sense of precision. Novabeyond can help structure market pairs, event definitions, measurement windows, and the finance-ready readout.
Plan a CTV geo-lift test with Novabeyond
Turn CTV Incrementality into iROAS Before You Scale
Incremental revenue is the difference between the treatment and control outcomes after adjusting for the relative size of the markets.
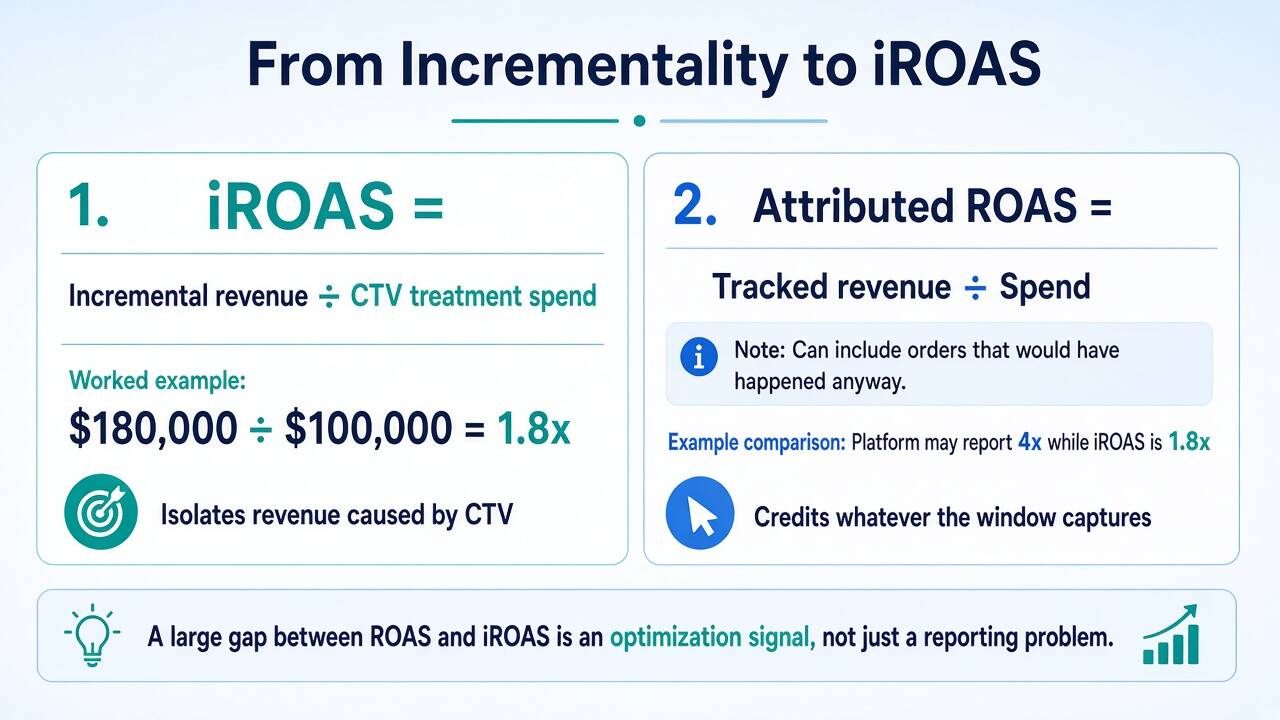
iROAS = Incremental Revenue ÷ CTV Treatment Spend
This distinction matters because platform ROAS can include orders that would have happened even if the TV budget had stayed dark.
For example:
CTV treatment spend: $100,000
Incremental revenue identified through the test: $180,000
iROAS: $180,000 ÷ $100,000 = 1.8x
The platform could report a much higher attributed ROAS if it also receives credit for branded search, retargeting, or existing customer demand. The iROAS isolates the portion of revenue associated with the measured incremental effect.
An attributed 4x can therefore sit next to an iROAS near 1x when the buy reaches households that other channels already convert efficiently. That is why the budget conversation should not stop at the platform number.
What to Report to Finance
Publish more than a single lift percentage.
Readout What to Publish How to Use It Attributed ROAS Platform or MTA revenue divided by CTV spend Daily optimization Incremental Lift Treatment versus control, size-adjusted Evaluate whether CTV changed outcomes iROAS Incremental revenue divided by treatment spend Compare CTV with other growth channels Confidence Range Statistical interval or clear underpowered flag Prevent noisy results from driving strategy
When the goal is for new users, also report incremental CAC:
Incremental CAC = CTV Treatment Spend ÷ Incremental Acquisitions
For profitability analysis, contribution margin can be more useful than gross merchandise value because the business ultimately needs to understand how much incremental value remains after variable costs.
If the test is underpowered, say so. A precise-looking number built on weak evidence is not more useful than an explicit statement that the test needs more volume.
Use the Gap Between ROAS and iROAS as an Optimization Signal
A large gap between attributed ROAS and iROAS is not simply a reporting problem. It can become an optimization brief.
Common areas to investigate include:
A view-through window that is too long
Frequency concentrated on households that already convert through retargeting
An audience dominated by existing customers
Supply with weak impression-quality controls
Cross-publisher frequency that is not being managed at the household level
CTV exposure overlapping heavily with other channels already capturing the same demand
The response is not automatically cut CTV. Instead, narrow the audience, tighten the frequency policy, improve supply quality, or shift budget toward inventory that can be verified. Then rerun the measurement.
The same blind spot appears when acquisition plans stop at blended ROAS instead of separating incremental contribution from total tracked revenue.
Look at Frequency Distribution, Not Just Average Frequency
An average household frequency of three can hide two very different situations: a large group that received one or two exposures and a smaller group that received ten or more. Ask for frequency distribution.
Review how incremental conversions change as exposure increases. If additional exposures stop generating measurable incremental outcomes, the campaign may be buying repetition rather than growth.
Cross-publisher frequency controls matter because a household can receive multiple exposures from different supply paths even when each individual publisher reports an acceptable frequency.
CTV ROI Measurement Checklist Before the Next Flight
Before adding budget, lock the measurement design before the media starts running.
Name the business event. Define whether the primary outcome is an install, qualified registration, first purchase, revenue, or another business event. Awareness should not be treated as an ROI denominator without a defined valuation framework.
Land impression logs where MTA can see them. Capture household or device keys, timestamps, placement IDs, and the fields needed to connect CTV exposure with downstream outcomes.
Agree on impression rules. Use the IAB and MRC video baseline so TV-off playback, continuous play, and inconsistent impression definitions do not inflate delivery.
Set one frequency policy. Manage frequency across publishers where possible and review the distribution weekly rather than relying on the campaign average.
Write the geo-lift protocol into kickoff. Define matched markets, control size, the pre-period, measurement window, business outcomes, and the rule that the control will not be opened early.
Decide the scaling rule in advance. Define the iROAS hurdle, the acceptable confidence range, and what happens when the test is underpowered. Optimize creative and supply through MTA while the causal test runs.
CTV can also change the efficiency of the next mobile or OEM touch. If TV is judged only on last-click installs, its assist may disappear from the reporting while the downstream channel receives all the credit. A properly designed holdout gives the growth team a better way to see that relationship.
For Novabeyond, this is where measurement connects directly to growth strategy. CTV measurement should not sit outside media buying. The results should influence audience selection, supply selection, frequency management, creative decisions, and future budget allocation.
FAQ
1. How do you measure CTV ROI if viewers do not click?
Treat the CTV exposure as a view in MTA, then use a holdout to evaluate incremental outcomes. Connect impression logs with installs, revenue, branded search, marketplace orders, store visits, or other relevant business events. Clicks can help with certain paths, but they are not required to establish a counterfactual.
2. What is the difference between ROAS and iROAS on CTV?
ROAS is tracked revenue divided by spend. It can include orders that would have happened without CTV. iROAS is incremental revenue divided by CTV treatment spend. It is designed to isolate the revenue associated with the measured incremental effect.
3. What is the difference between CTV MTA and CTV incrementality testing?
MTA describes the conversion path and helps optimize campaigns. Incrementality testing compares exposed and unexposed groups to estimate what changed because of CTV. MTA is useful for daily decisions, while a holdout is more appropriate for causal budget decisions.
4. How long should a CTV geo-lift test run?
The test should cover a meaningful buying cycle and include a pre-period that shows treatment and control markets were moving together. Many app and ecommerce tests may require around four to six weeks, depending on conversion volume and category dynamics. The correct duration depends on the test design rather than a universal number.
5. What view-through window should CTV multi-touch attribution use?
Start with the sales cycle. Seven days can fit fast app and ecommerce events, while 14 days can fit considered purchases. A 30-day window may be appropriate for genuinely longer conversion cycles, but it should be checked against a holdout so that organic and branded demand do not become attributed CTV revenue.
6. What is a good CTV iROAS?
There is no universal iROAS benchmark that works for every advertiser. The relevant hurdle depends on contribution margin, customer value, acquisition economics, payback period, and the alternatives available in the media mix. The important question is whether measured incremental return clears the business's predefined hurdle.
7. Can media mix modeling replace a geo-lift test?
No. MMM and geo-lift answer different questions. MMM can estimate contribution, lag, and saturation over longer periods. Geo-lift can test whether a specific CTV flight generated incremental outcomes. Experiments can also provide useful evidence for calibrating longer-term models.
8. When should you hold CTV budget rather than scale it?
Hold the next budget increase when the iROAS result does not clear the predefined hurdle, the confidence range is too wide, frequency is concentrated in a small high-exposure group, or impression quality remains unresolved. Fix the measurement or supply issue and run the test again rather than scaling from an uncertain result.
Conclusion
How to measure CTV ROI in 2026 is not about finding one perfect attribution model. It is about using the right measurement layer for the right decision. MTA shows which CTV exposures appear on the conversion path. Geo-lift shows whether CTV changed outcomes compared with a credible counterfactual. iROAS turns that incremental effect into a budget metric. MMM places CTV's contribution into the longer-term media plan.
The strongest CTV measurement programs connect these layers instead of asking one dashboard to answer every question. Design the holdout before the flight. Define the attribution window before the campaign starts. Control household frequency across supply paths. Report incremental revenue, iROAS, and the confidence range alongside attributed ROAS. Then use the results to improve the next buy.
Novabeyond helps growth teams build this system through OEM & CTV Growth Channels, combining performance-enabled CTV, cross-screen planning, audience and supply strategy, and a measurement framework that finance can audit. Bring your conversion event, target markets, current media mix, and CTV buying plan. Build the measurement framework before the next dollar is spent.
more posts

How OEM Advertising Unlocks App Scale in Emerging Markets
October. 09 2026
LEARN MORE


Why Most Brands Miss the Full Potential of OEM Advertising — How to Drive Smarter App Growth
August. 24 2026
LEARN MORE
Five Misconceptions About CTV Advertising That Are Holding Growth Teams Back
July. 28 2026
LEARN MORE

OEM Advertising : How Device-Level Placements Drive App Growth in Emerging Markets
July. 13 2026
LEARN MORE